


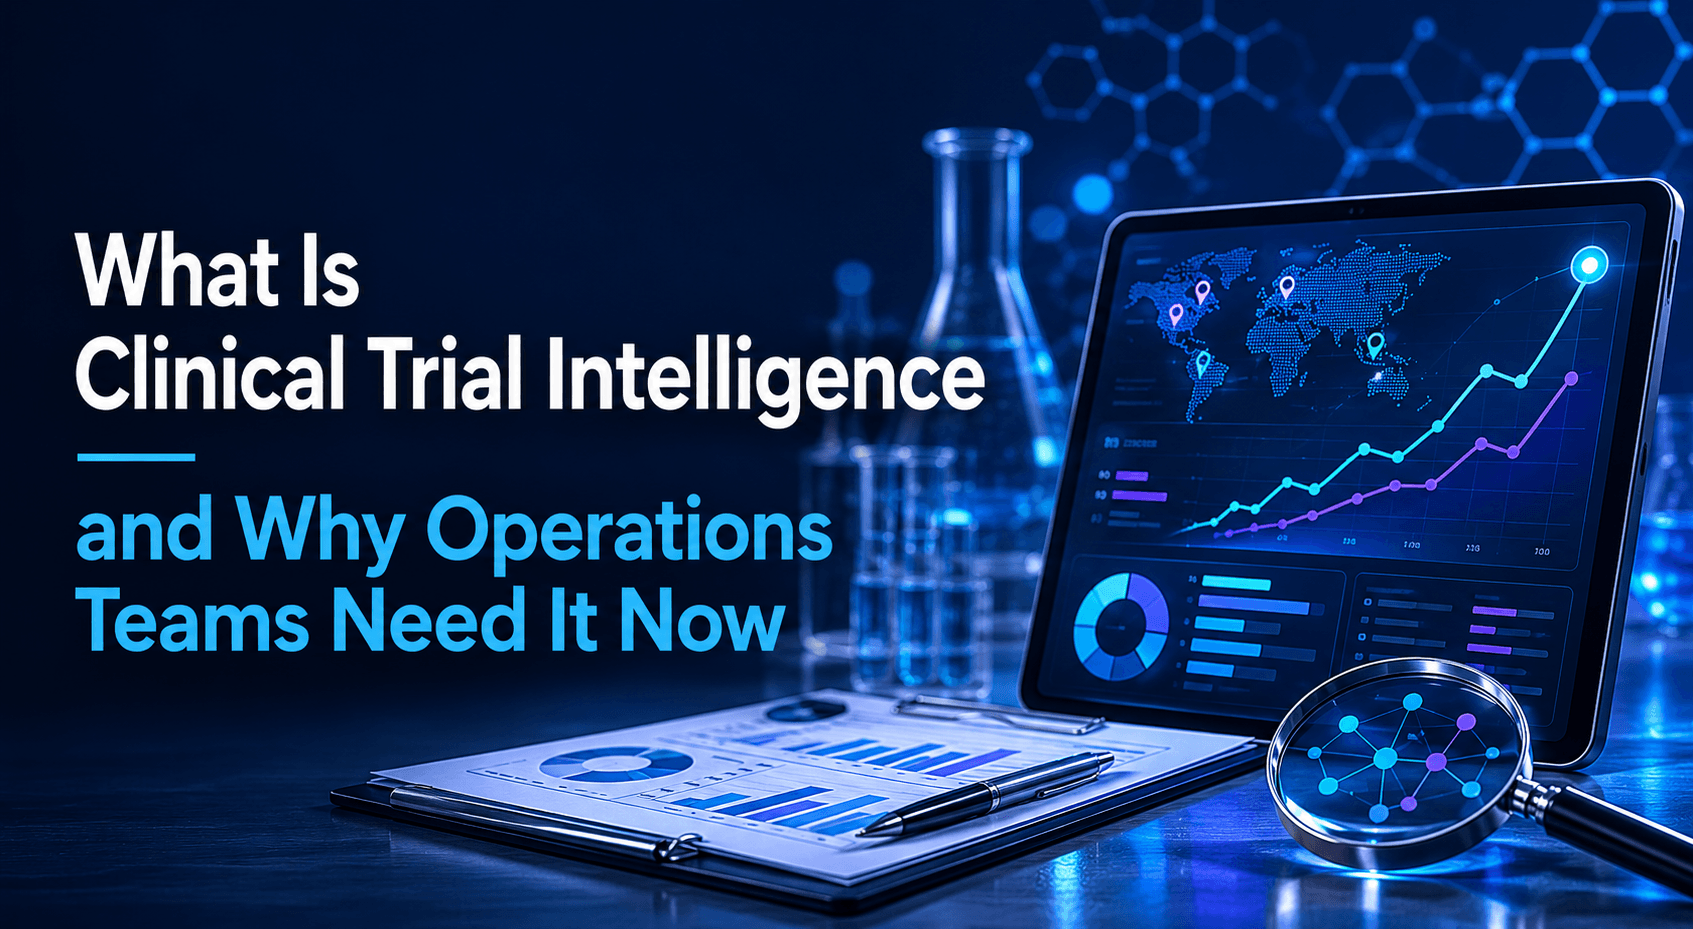
A clinical operations manager at a mid-size pharma company pulls up the enrollment dashboard for her Phase 3 trial. The numbers look fine – 67% of target enrollment, right on the projected curve. Two months later, enrollment stalls. Three sites in Eastern Europe stopped recruiting weeks ago but nobody flagged it. The trial timeline extends by five months. The cost overrun exceeds $4 million.
This scenario plays out across the industry every quarter. Not because operations teams are careless, but because most clinical trial monitoring systems track what already happened rather than predicting what will happen next. Clinical trial intelligence changes this. It turns trial data into forward-looking insight that helps operations teams intervene before timelines break.
This article explains what clinical trial intelligence covers, why standard reporting falls short, and how operations teams use it to run faster, smarter trials.
The Problem: Clinical Operations Runs on Lagging Indicators
Most clinical operations teams have data. They have EDC systems capturing site-level metrics. They have CTMS platforms tracking milestones and regulatory submissions. They receive monthly reports from CROs with enrollment updates and protocol deviation summaries.
The problem is not data volume. It is data timing and data connection.
Standard clinical reporting tells you what happened last month. It does not tell you what is likely to happen next month. A site that enrolled three patients in January and two in February might look stable. However, if screen failure rates at that site jumped from 15% to 40% in the same period, recruitment will collapse within weeks. Standard dashboards rarely connect these signals.
Traditional CTMS vs. Clinical Trial Intelligence
Three structural gaps define the problem:
Lag. Monthly reporting cycles mean site-level problems go undetected for 4-6 weeks. In a trial where every week of delay costs hundreds of thousands of dollars, that lag is expensive.
Isolation. Enrollment data sits in CTMS. Protocol deviations sit in the quality system. Regulatory timelines sit in TMF. Competitor trial data sits in someone’s inbox. These systems do not talk to each other.
No prediction. Knowing that a site enrolled five patients last month does not tell you whether it will enroll five next month. Screen failure trends, investigator engagement patterns, and local competition for the same patient population all affect future performance.
The Insight: Intelligence Is Not Just Better Reporting
Here is what separates clinical trial intelligence from standard clinical analytics. Analytics describes what happened. Intelligence predicts what will happen and recommends what to do about it.
This distinction matters because it determines how operations teams use the data. An analytics report that says “Site 42 enrolled 3 patients last month” goes into a spreadsheet. An intelligence alert that says “Site 42 enrollment is trending 40% below forecast due to rising screen failures – recommend protocol amendment review” triggers action.
According to Tufts Center for the Study of Drug Development, clinical trial delays cost sponsors $600,000 to $8 million per day depending on therapeutic area and phase.
The real insight: The biggest source of trial delay is not external factors like patient availability or regulatory timelines. It is internal detection speed. Operations teams that identify site-level problems within one week of onset recover timelines 3x more often than teams that discover problems at monthly reviews. Clinical trial intelligence is fundamentally about reducing that detection window.
Four Domains of Clinical Trial Intelligence
| Domain | What It Monitors | Intelligence Output |
|---|---|---|
| Site performance | Enrollment rates, screen failures, deviations, query resolution | Predictive site risk scores; early intervention recommendations |
| Recruitment forecasting | Patient screening trends, demographic mix, geographic patterns | Dynamic enrollment projections; recruitment gap alerts |
| Competitive landscape | Competitor trials, overlapping sites, patient pool competition | Competitive pressure maps; site selection intelligence |
| Regulatory tracking | Submission timelines, IRB/EC approvals, inspection readiness | Milestone risk flags; cross-country comparison |
What the Evidence Actually Shows
Most clinical operations teams already have reporting systems. The challenge is not access to data. The challenge is identifying risk before milestones are missed.
Traditional reporting systems excel at documenting activity. They show enrollment numbers, protocol deviations, and milestone completion dates. However, they rarely connect these signals into a forward-looking view of trial performance.
Clinical trial intelligence changes that by combining operational, recruitment, competitive, and regulatory data into a single decision layer.
The strongest evidence for clinical trial intelligence comes from three areas:
Enrollment forecasting. Dynamic models that continuously incorporate screening and recruitment data consistently outperform forecasts created during trial startup.
Site performance monitoring. Risk-based monitoring approaches identify underperforming sites earlier, allowing operations teams to intervene before enrollment timelines are significantly impacted.
Competitive trial tracking. Monitoring overlapping studies and patient recruitment activity helps sponsors anticipate enrollment challenges before they become visible in operational reports.
The key lesson is simple. The value of clinical trial intelligence is not that it generates more reports. The value is that it reduces the time between a problem emerging and the operations team taking action.
In clinical operations, earlier detection often matters more than perfect prediction.
Decision Intelligence: What Does Your Team Actually Need?
Not every operations team needs the same level of clinical trial intelligence. The right approach depends on your trial complexity, portfolio size, and current data infrastructure.
| Portfolio Complexity | Recommended Approach | Key Capabilities |
|---|---|---|
| 1-3 trials, single geography | Enhanced CTMS reporting + enrollment modeling | Predictive enrollment curves, basic site risk flags |
| 4-10 trials, multi-geography | Centralized intelligence layer | Cross-trial analytics, automated scoring, competitive monitoring |
| 10+ trials, global | Full intelligence platform | AI site selection, predictive timelines, integrated regulatory |
Bottom line: The question is not whether you need clinical trial intelligence. If you run clinical trials, you need it. The question is how much structure and automation your current portfolio demands.
The Solution: How Clinical Trial Intelligence Works
Clinical trial intelligence operates through three connected layers.
Layer 1: Data integration. The system connects to your CTMS, EDC, and regulatory tracking tools. It also ingests external data – ClinicalTrials.gov for competitor trial activity, regulatory database feeds for submission tracking, and real-world data sources for patient population modeling.
Layer 2: Signal detection. Instead of waiting for monthly reports, the intelligence layer continuously monitors key metrics and flags anomalies. A sudden increase in screen failure rates. A competitor trial opening at overlapping sites. Each signal generates an alert scored by severity and timeline impact.
Layer 3: Predictive analytics. Using historical trial data and current performance trends, the system generates forward-looking projections. Dynamic enrollment curves that update weekly. Site performance predictions based on early screening patterns. Timeline risk assessments factoring competitive activity and regulatory delays.
Three-Layer Intelligence Architecture
The Value: Measurable Outcomes for Operations Teams
Operations teams that implement clinical trial intelligence report improvements in three areas.
Shorter detection-to-action cycles. The average time between a site-level issue emerging and the operations team taking corrective action drops from 4-6 weeks to 1-2 weeks.
More accurate enrollment forecasts. Dynamic enrollment projections that update based on real screening data are consistently 30-40% more accurate than traditional forecasts built at trial startup.
Better site selection for future trials. Intelligence from current trials feeds directly into site selection for the next trial. Sites with strong performance data get prioritized. Sites with failure patterns get additional evaluation.
Clinical Operations: Traditional vs. Intelligence-Enabled
Traditional
6 weeks
Intelligence
1.5 weeks
Traditional
60%
Intelligence
85%
Traditional
70%
Intelligence
88%
Example: A Phase 3 Operations Manager’s Before and After
Consider a clinical operations manager at a 400-person pharma company running a Phase 3 cardiovascular trial across 80 sites in 12 countries.
Before intelligence: Monthly enrollment reports arrive on the 15th. She reviews site-by-site numbers, flags underperformers, and schedules calls with monitors. By the time corrective action starts, underperforming sites have struggled for 6-8 weeks. Enrollment extensions are requested three times. Total delay: 7 months.
After implementing clinical trial intelligence: The system flags three sites in Week 6 – screen failure rates doubled, investigator engagement dropped, and a competitor trial opened at nearby sites. She receives scored alerts ranked by timeline impact. She activates backup sites within 10 days and initiates a protocol amendment review. The trial completes enrollment 2 months ahead of the rescue timeline.
The difference is not heroic intervention. It is earlier detection. The same problems existed in both scenarios. Intelligence revealed them faster.
How to Build a Sustainable CI Function for Operations Teams
A clinical trial intelligence function earns its place in the operations budget by answering questions before they become crises. The three questions a well-run CI function answers continuously: Where is our main competitor in their Phase 3 – and could they file before us? Which sites are running competing trials that will reduce our enrollment rate? What protocol design features are our closest competitors using that we have not considered? These are operational intelligence questions, not academic ones. Building the function around answering these three questions – with defined data sources, update frequencies, and delivery formats for each – creates a CI capability that operations teams reference rather than ignore.
Conclusion
Clinical trial intelligence turns operational data into forward-looking insight that helps teams prevent delays instead of reacting to them.
Its value extends beyond reporting. By connecting site performance, recruitment forecasting, competitive activity, and regulatory tracking, intelligence enables operations teams to identify risks earlier and act faster.
The organizations that consistently deliver trials on time are rarely those with perfect trial execution. They are the organizations that detect problems sooner than everyone else.
For clinical operations leaders, the most important question is not whether you have enough data. It is whether your team can identify enrollment, site, and timeline risks early enough to change the outcome.
If the answer is still measured in monthly review cycles, clinical trial intelligence represents one of the highest-impact operational investments available today.
What is clinical trial intelligence?
Clinical trial intelligence combines operational, recruitment, regulatory, and competitive data to identify risks, forecast outcomes, and support faster decision-making throughout the clinical development process.
Why is clinical trial intelligence important?
Clinical trial intelligence helps operations teams detect enrollment challenges, site performance issues, and timeline risks earlier, reducing delays and improving trial execution.
What data sources are used in clinical trial intelligence?
Common sources include CTMS platforms, EDC systems, ClinicalTrials.gov, regulatory databases, CRO reports, site performance metrics, and competitive trial intelligence databases.
How does clinical trial intelligence improve enrollment forecasting?
By continuously analyzing screening rates, enrollment trends, site performance, and competing trial activity, intelligence systems generate more accurate and dynamic enrollment projections.
About the Author

Hamza
Healthcare Market Research and Business Development Specialist with a strong focus on pharmaceutical, biotech, and life sciences sectors. Experienced in analyzing market trends, competitive landscapes, and growth opportunities to support strategic decision-making. Skilled in transforming complex healthcare data into actionable insights that drive business expansion, partnerships, and revenue growth.
Related Articles
How AI Is Changing Clinical Trial Design in 2025
A CMO reviews a Phase 2 protocol. The team has designed a traditional randomized, double-blind,…

China Biotech Licensing Wave: What It Means for Western BD Teams
In 2023, Chinese biotechs signed over $50 billion in total deal value with Western pharma…
Decentralized Clinical Trials: Benefits, Limitations and When to Use Them
During the pandemic, a Phase 3 trial for a cardiovascular drug shifted from 100% site-based…